
A project by xClinic Environmental Health Clinic at NYU and the Living Architecture Lab at Columbia Graduate School of Architecture, Planning and Preservation, AMPHIBIOUS ARCHITECTURE attempts to generate a new dialogue between the environment and us.
The description, quoted from the site, since it’s more clear than my attempt at synthesizing the information would be:
“Installed at two sites along the East and the Bronx Rivers in New York, the project is a network of floating interactive buoys housing a range of sensors below water and an array of LEDs above water. The sensors monitor water quality, the presence of fish, and human interest in the river’s ecosystem, while the lights respond to the sensors, creating feedback loops between humans, fish in their shared environment.
Additionally an SMS interface allows homo-citizens to text-message the fish and receive real-time information about the river, contributing towards the collective display of human interest in the aquatic environment. The aim of which is to simultaneously spark a larger public interest and dialogue about our local waterways.”

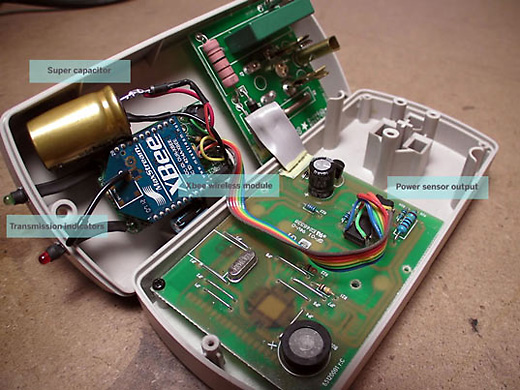
These are the sensors lit up before being installed in the river. To see some video of the sensors actually installed and floating, you’ll have to check out the site’s landing page.

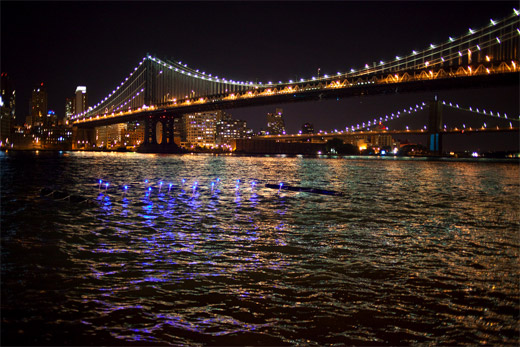
This is an image of some of the sensors lit up, being activated by passing fish, water conditions, and text messages. It’s an amazing cool project, especially given our proximity and recent interest in imagining some kind of Detroit River based project.