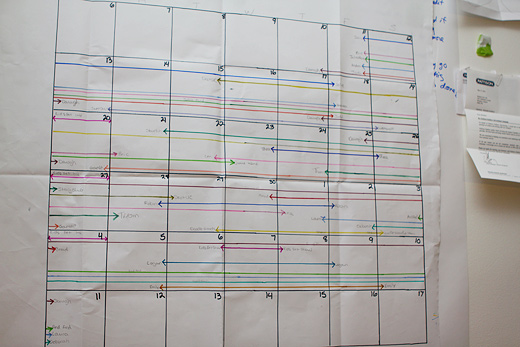
Making Sense of Big Group Calendars

This is the third calendar iteration for SRSI. We’re getting close to having things finalized, which means we’ll be announcing the whole list of artists, activities, and events very soon.

Michelle put this particular calendar together after the whole crew assembled a working calendar last week.

We’re also anticipating on making a long, timeline(d) calendar for display, but that’s sort of low on the priority list.

Danielle and I were on a panel with InCUBATE last week as part of Open Engagement, where they spoke about their radical arts admin practice. Making calendars, planning schedules, revising budgets, and organizing so many people / spaces / ideas certainly makes me wonder about what we’re doing now that could actually help inform other projects. How do we keep track of the tactics we’re using to pull off SRSI that could be discussed alongside our other projects? Or is this just part of the process of pulling together another project?
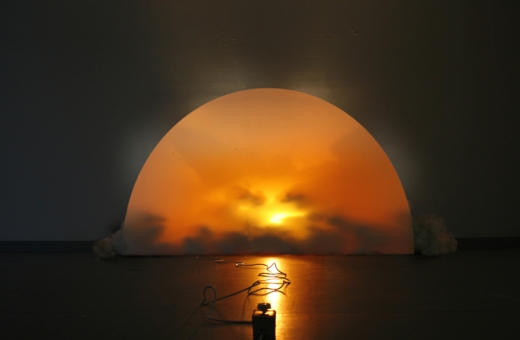
Sunset Now

Sunset Now by Adam Parker Smith

It’s been a little while since we’ve posted other people’s work, but I really like the idea of keeping an ongoing archive of interesting works. So, here is Adam Parker Smith’s Sunset Now. The viewer can adjust the speed of the sunset via the dimmer switch placed in front of the plexiglass sun.

[via]

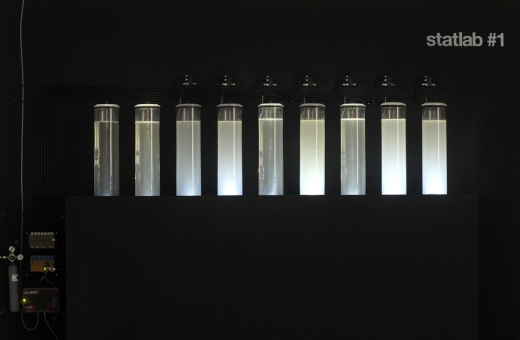
Statlab by Tjerk Stoop

Statlab by Tjerk Stoop

Statlab by Tjerk Stoop is an environmental art project, creating an analog visualization of air quality. From Stoop’s website, “It displays the daily average of CO2 concentration trough a chemical reaction where chalk particles are formed. The result is an analogue graph where the difference in the amount of chalk particles per tank is a global measure for the fluctuating CO2 concentration within one week.” Great to see physical/analog visualization presenting important data in a clear manner (well, assuming you read the accompanying text).

[via]