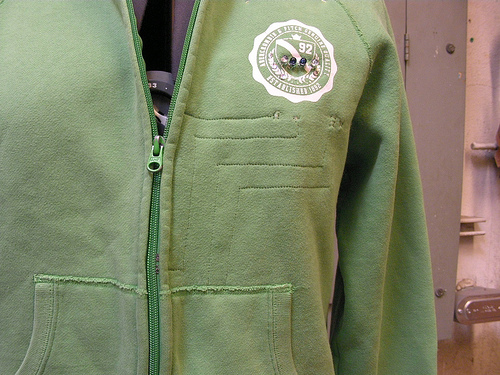
Rebecca Stern from FAT Labs and Sternlab made a hoodie function as a TV-B-Gone. I think we had tossed around the idea of doing this, though her execution is really slick—you just have to zip or unzip the zipper to turn the targeted TV off.
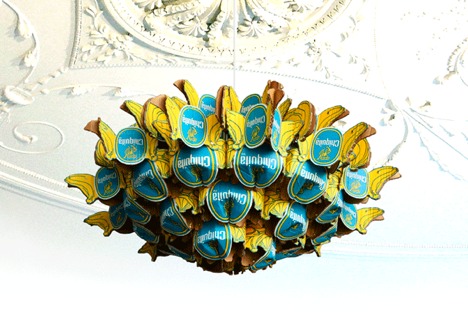
Anneke Jakobs made a chandelier from 3 banana boxes and then offered a detailed set of instructions on how to make your own. I also like her Measurement project. Reusing and rethinking the way things are used is always exciting—all the better when it’s a mundane source.
[via]

Broken City Lab will also be recruiting Field Researchers so bring your ideas and suggestions and MAKE THINGS HAPPEN!
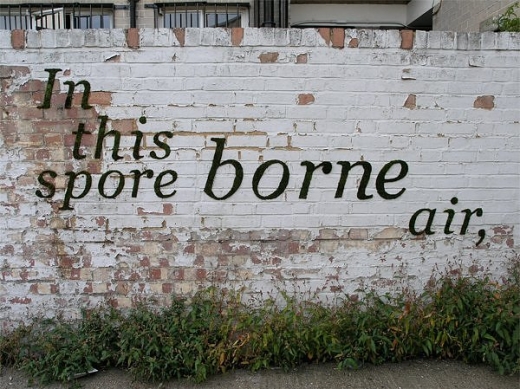
Anna Garforth is a designer and illustrator by trade, but has been working with environmentally themed public and community artworks as of late. Along with working with moss graffiti inMossenger, Garforth is also engaging in creating planters made by recycling milk containers in a project entitled Head Gardener, and then leading workshops to teach elementary school students how to do the same with Little Gardener.
[via]
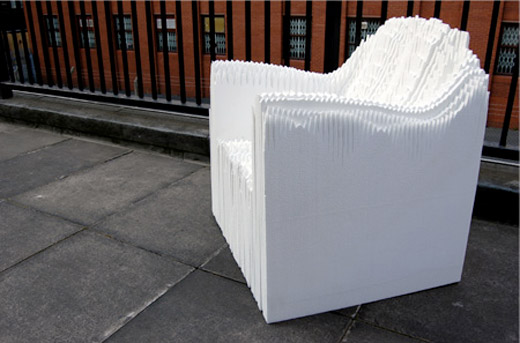
Sound/Chair by Matthew Plummer Fernandez was the result of testing 719 sounds to see which one produced the best physical object. Using 3D visualization software he wrote, Plummer Fernandez graphs the sound on a volume/time/frequency plot, thereby realizing “the beautiful and unexplored aesthetic of sound […] a landscape of spikes and shapes that vary accordingly to the type of sound.”
Plummer Fernandez is a Royal College of Art (soon to be graduate?) and designer based in London, though I find many of his “self-initiated” projects most interesting—The Sound of Light (“A casing is made for a flourescent tube light by recording and graphing 1 second of the ‘hum’ sound produced by the light”) and Sound Tagging (“Most large buildings have distinct auditory signatures as a result of vibrations generated by traffic, underground, and wind that resonate through the solid structures”)—remind me of what I love about sound.

Direct Hit is one of the many inflatable streetart works by FilthyLuker. Lots of work dealing with trees with eyes, bananas, and tentacles.
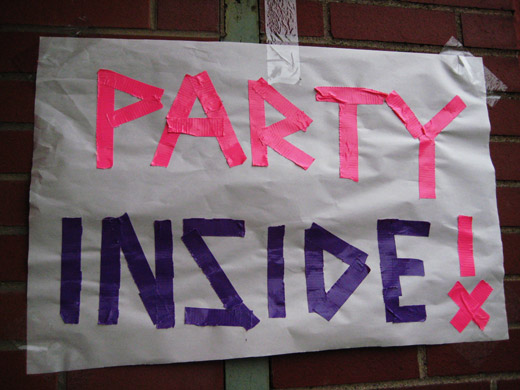
Although the Dance Party was technically supposed to be a Parking Lot Party, the rain forecast and the subsequent move inside the gallery didn’t stop the awesomeness from happening!!! We have to extend a huge thank you to the following people and places: the School of Visual Arts for letting us throw down, Sandeep Soor, Jason Child, Justin James, Matt Herdman, Stephen Surlin, Cristina Naccarato for the Super Nintendo cable, the Blatherwicks for the mint leaves, Bob Soulliere at Cardinal Music (519-966-6400) for the audio equipment, Meaghan for helping with tea, and Chelsea for Christmas lights/dancing up a storm!
Incredibly fun night overall, and hopefully just the first of many dance-related events in the future. Continue reading “BCL Report, Post-Dance Party”
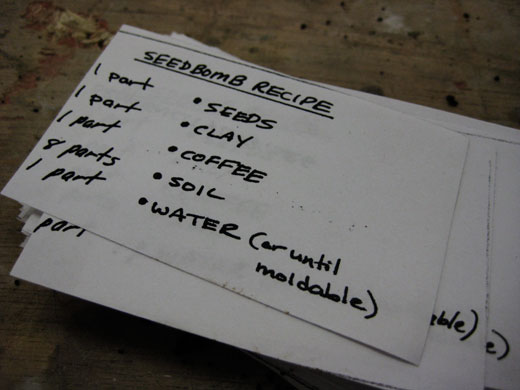
Broken City Lab held its first public demo today—we showed incoming visual arts students how to make seedbombs! Here’s our recipe: 1 part seeds, 1 part clay, 1 part coffee grounds, 8 parts soil, 1 part water.
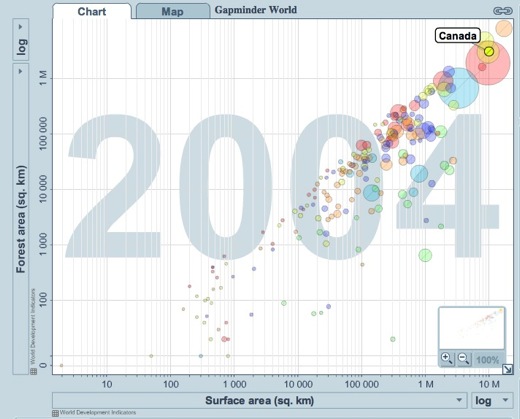
I watched a TED talk sometime over the summer by Hans Roslings, in which he talked about data visualization, specifically using Gapminder. The website, Gapminder World is powered by Trendalyzer, and “enables you to explore the changing world from your own computer.” Perhaps most interesting is that the software allows you to see changes over time, seeing the way things change and the ways in which those changes are interrelated. If you visit the site, make sure to press the play button below the graph before you do anything else—it really helps to understand the possibilities of the software.
I’m very interested in trying to imagine what it would do, in terms of change, if we did have a better understanding of the way in which we and our actions are interconnected to other people and situations across the world and 20 years from now. Are graphs with moving the circles the best way to do this? I’m not sure, but I think the idea behind the tool is incredibly important.
[via]
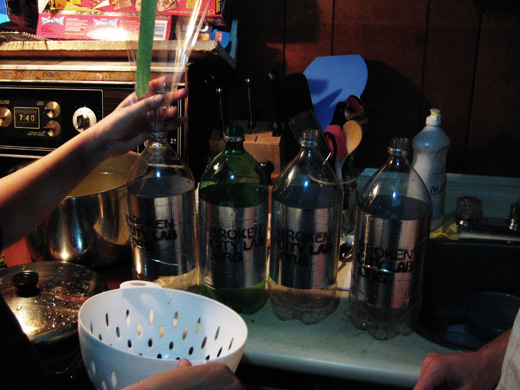
We spent quite a while this evening trying to perfect our tea recipe and then brewing almost 20 litres of it, in preparation of the upcoming Dance Party. In the photo above, we were in the middle of trying to figure out the best way to funnel the pots of tea into our reused (and cleaned) 2 litre bottles. We settled on transferring from the pot to another container with a lip on it, which made it infinitely easier to get the tea into the 2 litres, and gave us the opportunity to do some straining in between. We’ll post our recipe for the tea soon. We also re-evaluated our previous origami attempts and came up with a better solution, in time for our Wednesday Seedbomb demo.